

Car Theft Capitals of the United States (2021)
While car theft has somewhat decreased over the last decade, in some cities, cars are still stolen at alarmingly high rates.
Last year, 721,885 vehicles were reported stolen in the United States, according to the Insurance Information Institute (III). If spread evenly across the year, nearly 2,000 would occur each day. Although considerably lower than in the 1990s when automotive theft reached its peak, the rate of car theft has hardly changed over the last decade. In fact, car thefts last year were down only 2.4 percent since 2010.
The coronavirus pandemic has also provoked significant changes in driving habits over the past year. Many people are driving less due to shelter in place orders throughout the nation. With cars left idle for longer periods, drivers across the country are left more vulnerable to automotive theft than ever before; in fact, many thieves will steal a car right out of the owner’s driveway.
Car theft has significant repercussions both on an individual and community level. The vast majority of Americans rely on their car to purchase food or commute to work, and the loss of this transportation ability can be devastating. Moreover, replacing a stolen car is costly, even with auto insurance. Besides the upfront cost of a deductible, insurance premiums can increase considerably after the incident. The entire community also experiences the detrimental consequences of car theft, which is associated with increases in crime rates; thieves often use stolen cars to commit additional crimes.
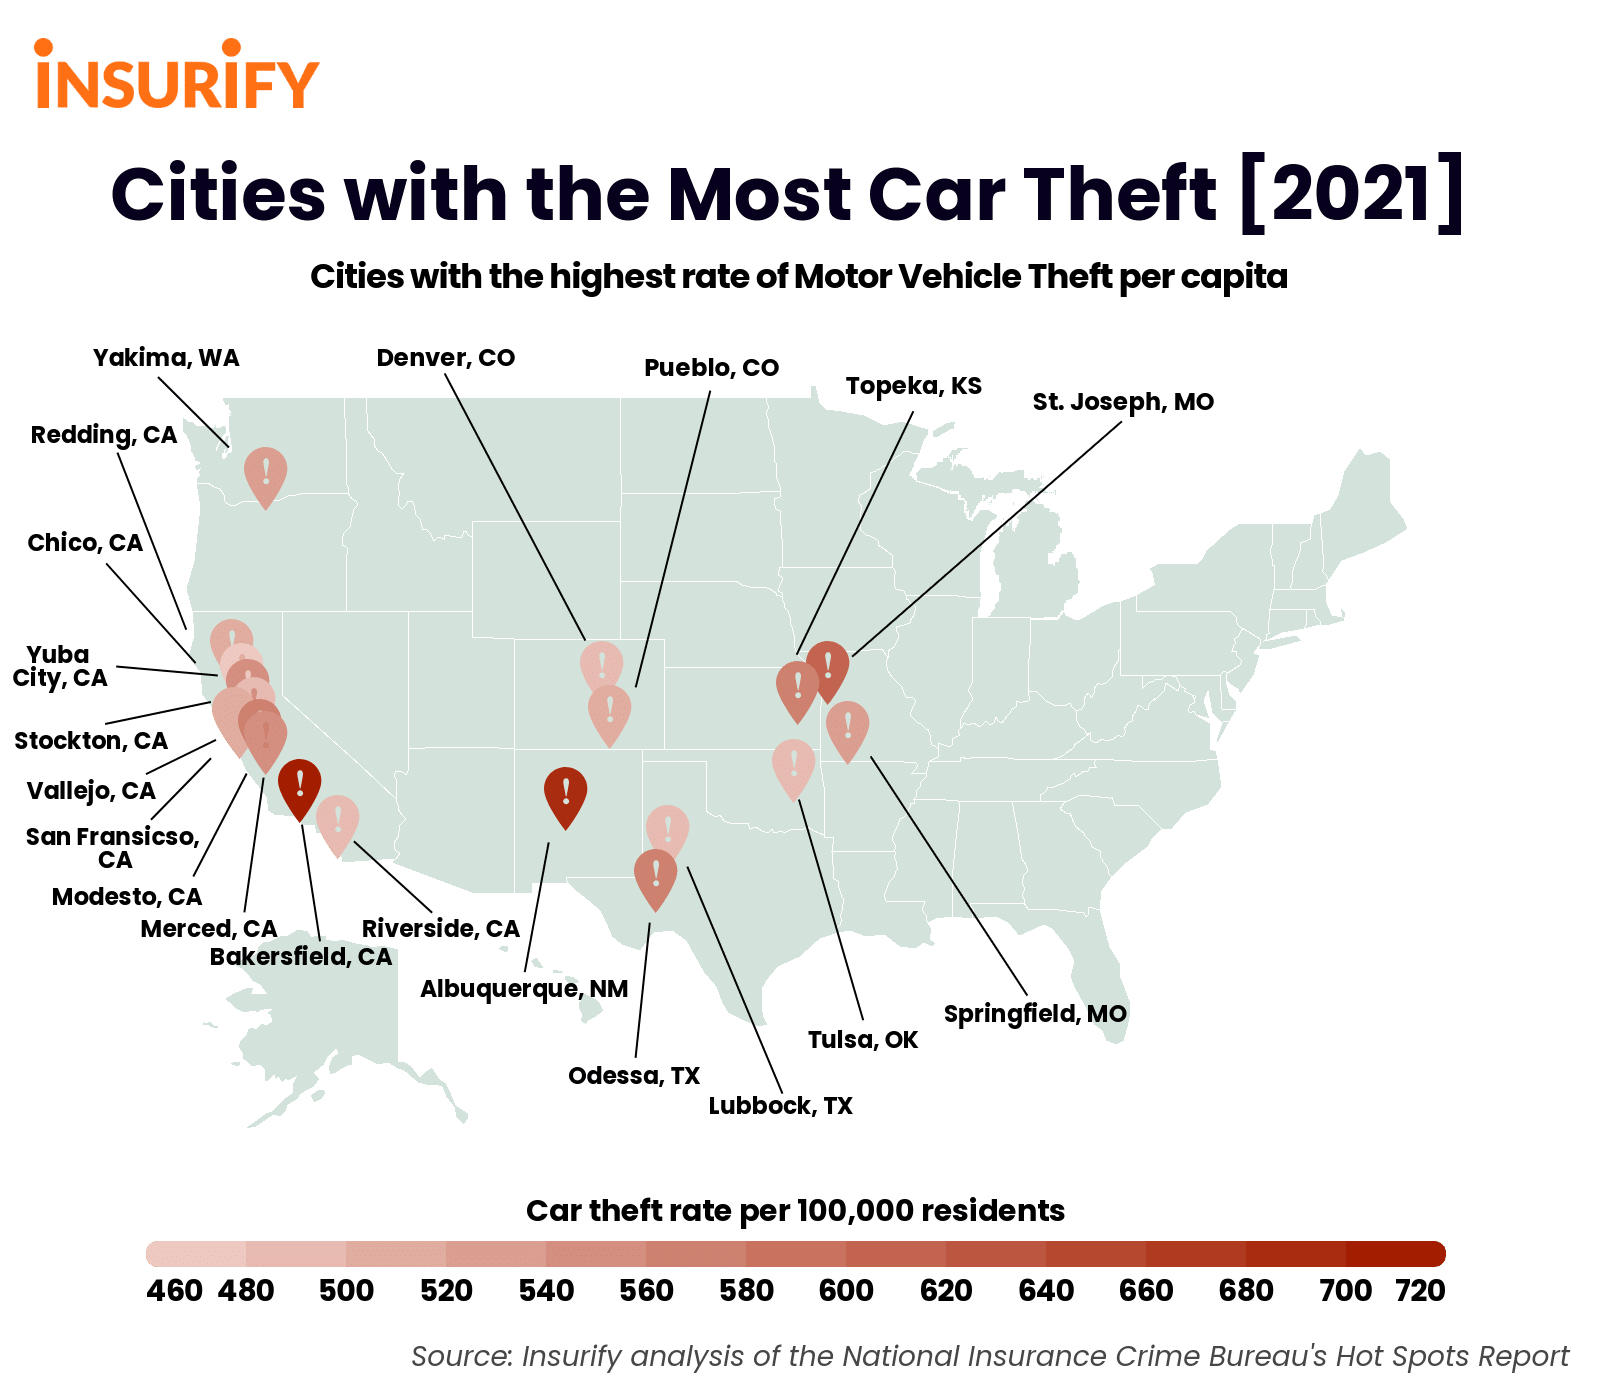
Researchers at Insurify referred to data from the National Insurance Crime Bureau (NICB) to determine the top 20 cities with the most car thefts per capita. In the interest of public safety and awareness, this report also concludes with simple and cost-effective steps drivers can take to safeguard against car theft.
Insights
- National averages. The average car theft rate across all cities in the United States is 207.18 vehicles stolen per 100,000 residents. Among the 20 cities experiencing the highest incidence of car theft, the average car theft rate is more than twice as high, at 535.91 vehicles stolen per 100,000 residents.
- California carjackers. The Golden State has been hit hard this year, from wildfires to soaring COVID-19 case counts. Unfortunately, susceptibility to car theft is no exception either. A whopping ten of the twenty cities with the highest motor vehicle theft rate are located up and down California’s Interstate 5, from Redding in the north all the way to Riverside in the south. In fact, their proximity to major highways like the I5 makes for easy getaways for car thieves, who can cover considerable ground or even cross state lines within a short time. In addition, the Public Policy Institute of California (PPIC) attributes the rise in car thefts in the state in part to the implementation of the state’s Public Safety Realignment Act, which caused prisons to release inmates early beginning in 2011.
- Cities with the fewest car thefts. On the opposite side of the spectrum are cities with the lowest car theft rates in the nation. This year, according to the latest data, these cities are Lahaina, Hawaii; Glen Falls, New York; and State College, Pennsylvania. These three MSAs have reported 0, 17.58, and 19.09 car thefts per 100,000 residents, respectively, as of the latest data.
Methodology
The data scientists at Insurify, a site to compare auto insurance rates, compiled data from the National Insurance Crime Bureau (NICB) on auto theft rates in all 384 Metropolitan Statistical Areas (MSA’s) of the United States. From this data, they identified the top twenty cities reporting the highest auto theft incidence per 100,000 residents. Insurify’s data scientists also calculated the average motor vehicle theft rate across all 384 MSA’s. From this number, they determined how much more frequently auto thefts occurred in these top 20 cities compared to the national average.
Population data for each of the top 20 cities were gathered from the United States Census Bureau.

U.S. Cities with the Most Car Thefts Per Capita
1. Bakersfield, CA - motor vehicle theft per 100k: 726.28
2. Albuquerque, NM - motor vehicle theft per 100k: 697.05
3. St. Joseph, MO-KS - motor vehicle theft per 100k: 614.90
4. Modesto, CA - motor vehicle theft per 100k: 573.13
5. Odessa, TX - motor vehicle theft per 100k: 569.11
6. Topeka, KS - motor vehicle theft per 100k: 557.40
7. Yuba City, CA - motor vehicle theft per 100k: 546.01
8. Merced, CA - motor vehicle theft per 100k: 534.07
9. Yakima, WA - motor vehicle theft per 100k: 528.16
10. Springfield, MO - motor vehicle theft per 100k: 514.57
11. Redding, CA - motor vehicle theft per 100k: 503.67
12. Pueblo, CO - motor vehicle theft per 100k: 493.99
13. Vallejo, CA - motor vehicle theft per 100k: 492.58
14. San Francisco-Oakland-Berkeley, CA - motor vehicle theft per 100k: 492.33
15. Lubbock, TX - motor vehicle theft per 100k: 485.64
16. Tulsa, OK - motor vehicle theft per 100k: 483.86
17. Stockton, CA - motor vehicle theft per 100k: 483.63
18. Riverside-San Bernardino-Ontario, CA - motor vehicle theft per 100k: 478.34
19. Denver-Aurora-Lakewood, CO - motor vehicle theft per 100k: 474.95
20. Chico, CA - motor vehicle theft per 100k: 468.55
20 Cities with the Most Car Thefts Per Capita
20. Chico, California
- Population: 219,186
- Motor vehicle theft per 100k: 468.55 (2.26 times the national average)
19. Denver-Aurora-Lakewood, Colorado MSA
- Population: 2,967,239
- Motor vehicle theft per 100k: 474.95 (2.29 times the national average)
18. Riverside-San Bernardino-Ontario, California MSA
- Population: 4,650,631
- Motor vehicle theft per 100k: 478.34 (2.31 times the national average)
17. Stockton, California
- Population: 762,148
- Motor vehicle theft per 100k: 483.63 (2.33 times the national average)
16. Tulsa, Oklahoma
- Population: 998,626
- Motor vehicle theft per 100k: 483.86 (2.34 times the national average)
15. Lubbock, Texas
- Population: 322,257
- Motor vehicle theft per 100k: 485.64 (2.34 times the national average)
14. San Francisco-Oakland-Berkeley, California MSA
- Population: 4,731,803
- Motor vehicle theft per 100k: 492.33 (2.38 times the national average)
13. Vallejo, California
- Population: 447,643
- Motor vehicle theft per 100k: 492.58 (2.38 times the national average)
12. Pueblo, Colorado
- Population: 168,424
- Motor vehicle theft per 100k: 493.99 (2.38 times the national average)
11. Redding, California
- Population: 180,080
- Motor vehicle theft per 100k: 503.67 (2.43 times the national average)
10. Springfield, Missouri
- Population: 470,300
- Motor vehicle theft per 100k: 514.57 (2.48 times the national average)
9. Yakima, Washington
- Population: 250,873
- Motor vehicle theft per 100k: 528.16 (2.55 times the national average)
8. Merced, California
- Population: 277,680
- Motor vehicle theft per 100k: 534.07 (2.58 times the national average)
7. Yuba City, California
- Population: 175,639
- Motor vehicle theft per 100k: 546.01 (2.64 times the national average)
6. Topeka, Kansas
- Population: 231,969
- Motor vehicle theft per 100k: 557.4 (2.69 times the national average)
5. Odessa, Texas
- Population: 166,223
- Motor vehicle theft per 100k: 569.11 (2.75 times the national average)
4. Modesto, California
- Population: 550,660
- Motor vehicle theft per 100k: 573.13 (2.77 times the national average)
3. St. Joseph, Missouri-Kansas MSA
- Population: 125,223
- Motor vehicle theft per 100k: 614.90 (2.97 times higher the national average)
2. Albuquerque, New Mexico
- Population: 918,018
- Motor vehicle theft per 100k: 697.05 (3.36 times higher the national average)
1. Bakersfield, California
- Population: 900,202
- Motor vehicle theft per 100k: 726.28 (3.51 times the national average)
How to prevent car theft
- Never leave your car running and unattended: Leaving your vehicle running and unattended is like a waiting invitation for someone to steal your car. Even if locked and running, your vehicle is still susceptible; most thieves are seasoned professionals able to break into a car within a minute.
- GPS tracking: Only about half of stolen vehicles are ever recovered, so installing a GPS tracking device inside your vehicle can be the difference between recovering it and losing it forever. Priced between $50 and $150, GPS tracking devices are incredibly cost-effective compared to the headache and cost of replacing a stolen vehicle. Needless to say, they pay for themselves many times over in the event that an auto theft occurs.
- Install an anti-theft system: Most cars manufactured recently come with decent security systems. However, this alone may not be enough to deter a thief, especially given how advanced the technology used by many professional car thieves has become. Kill switches, steering wheel locks, or brake locks, can significantly decrease the likelihood of your car being stolen. Some auto insurance providers also offer discounts on purchases of devices like these.
If you have any questions or comments about this article or would like to request the data, please contact insights@insurify.com.
More From 98.3 KEYW


